Step 1
Connect your data
Your practice software, QuickBooks, your budget sheets, your phones, your marketing, finance and payroll. Our team sets up each connection with you. Using something not on the list? Ask us and we will connect it.
Everything SmileData connects to


 QuickBooks
 Excel budgets and goals



 Google Analytics
 Search Console
 Google Ads

 Google Business Profile
 Tag Manager







Step 2
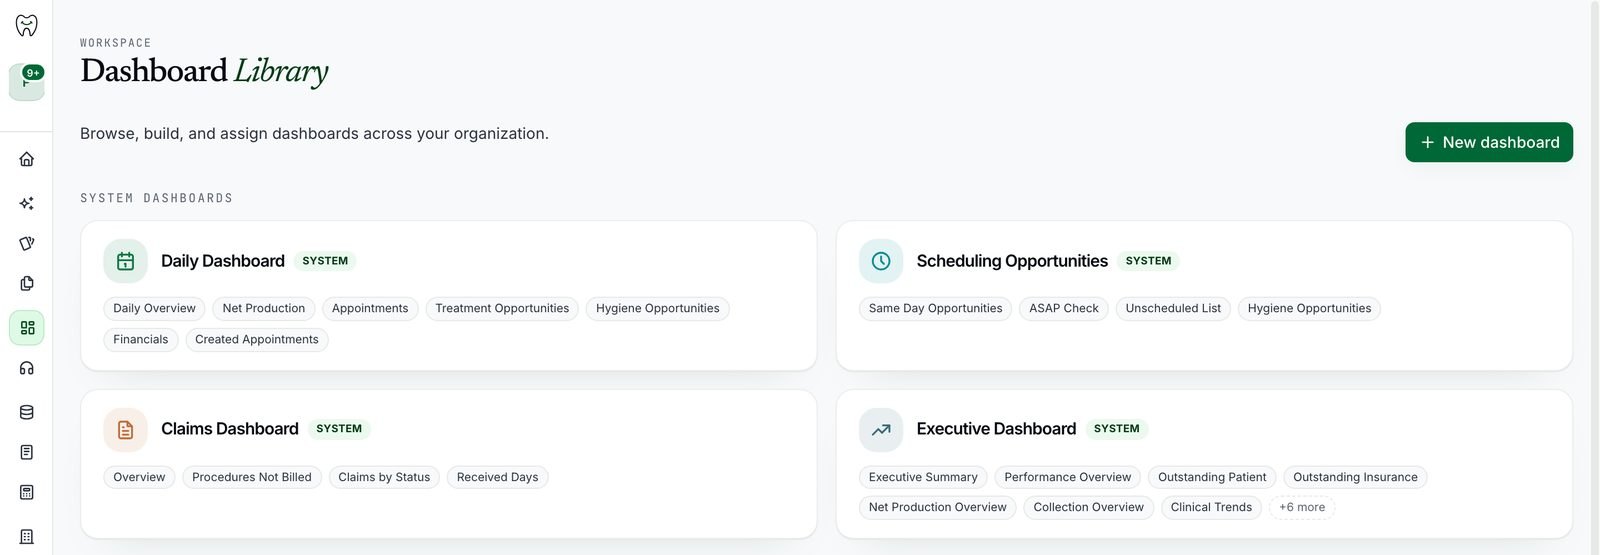
Get pre-built dashboards
Four dashboards are ready as soon as your data is connected, each a set of pages with filters. Tap the i next to any number to see exactly how it is calculated.
Step 3
Ask in plain English
Name the number, the time window and the chart you want, or leave the chart out and it picks one. Not sure what to ask? Ask it for suggestions.
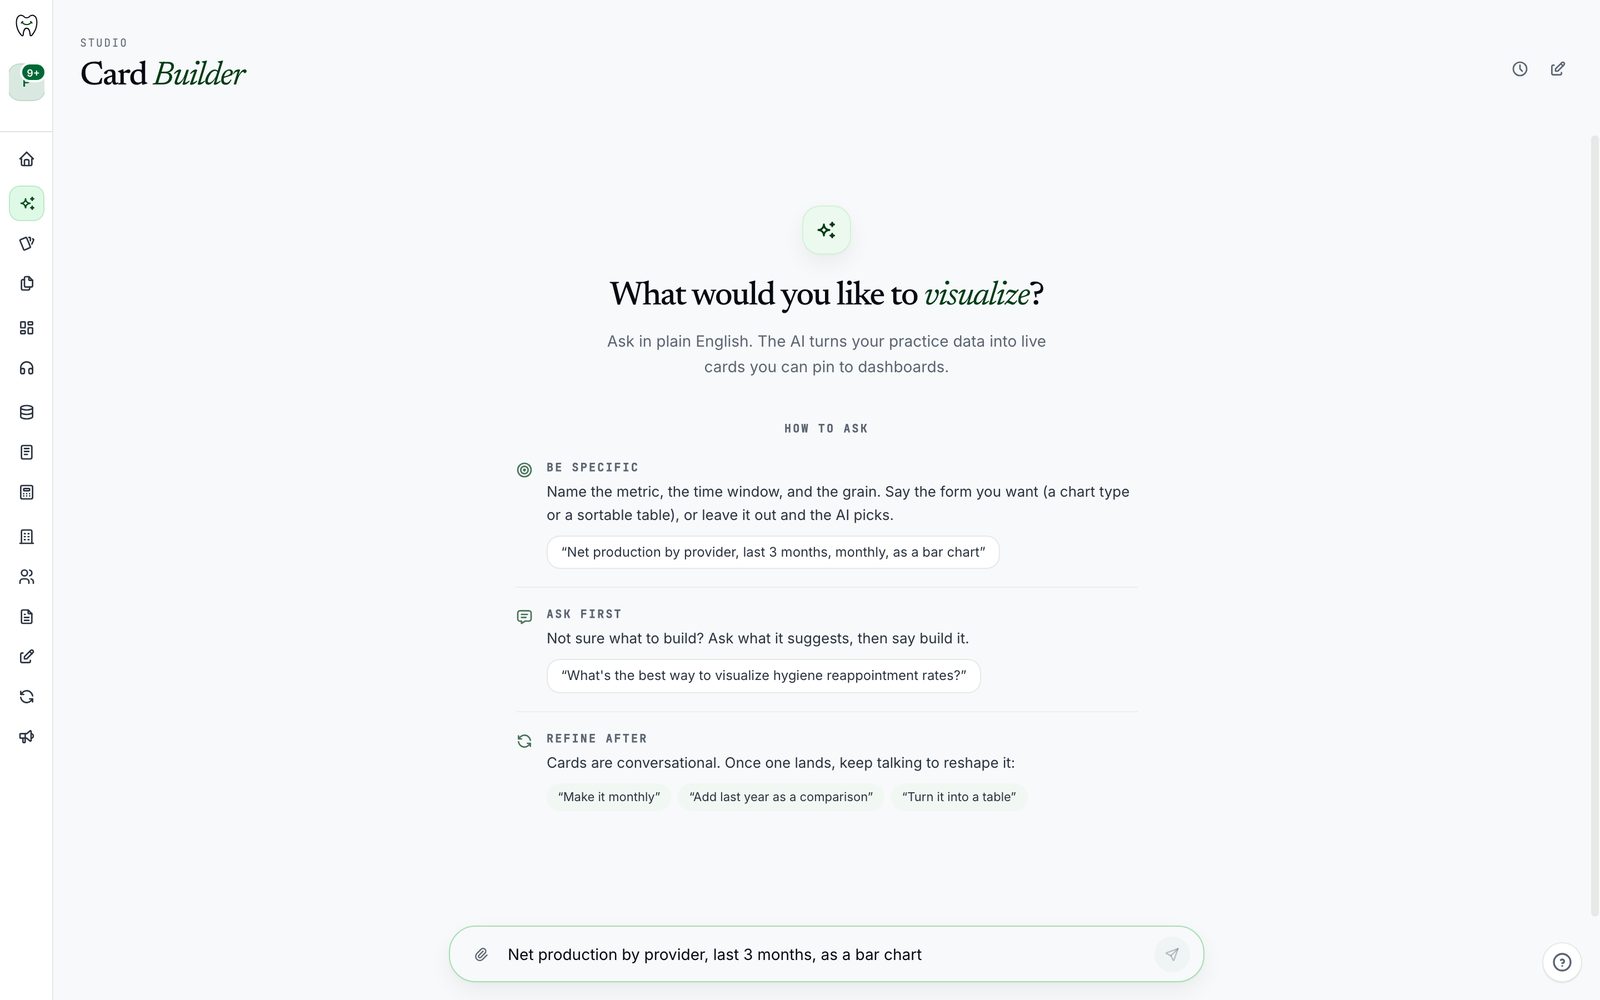
- AskNet production by provider, last 3 months, as a bar chart
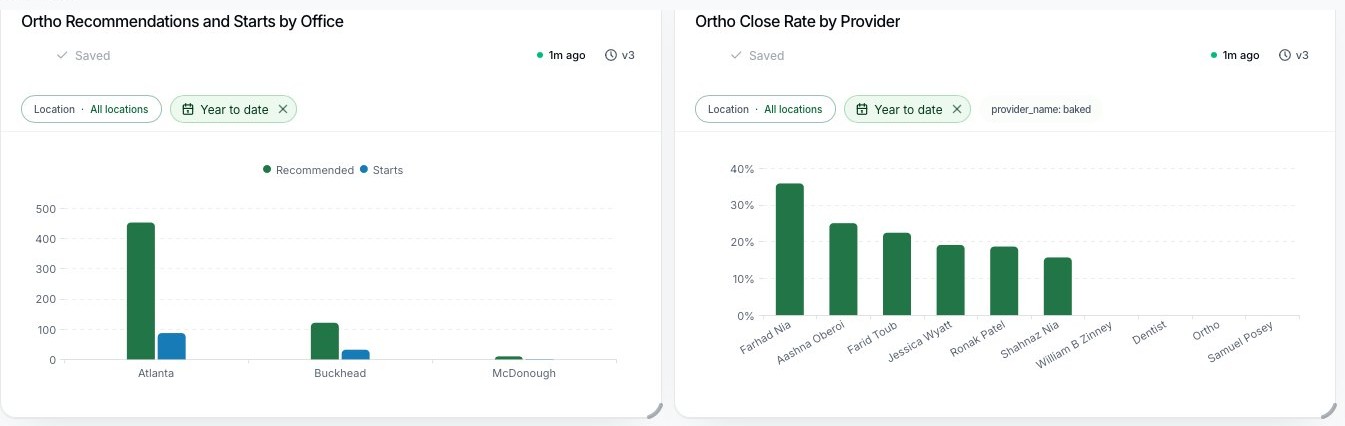
- AskOrtho recommendations and starts by office, and close rate by provider
- AskA morning huddle sheet for my offices
- AskPatients with a balance over 91 days, oldest first
Step 4
Each answer is a saved card, your building blocks
Every card is saved to your card library, refreshes every night with the rest of your data, and keeps its versions. Keep typing to change it.
Step 5
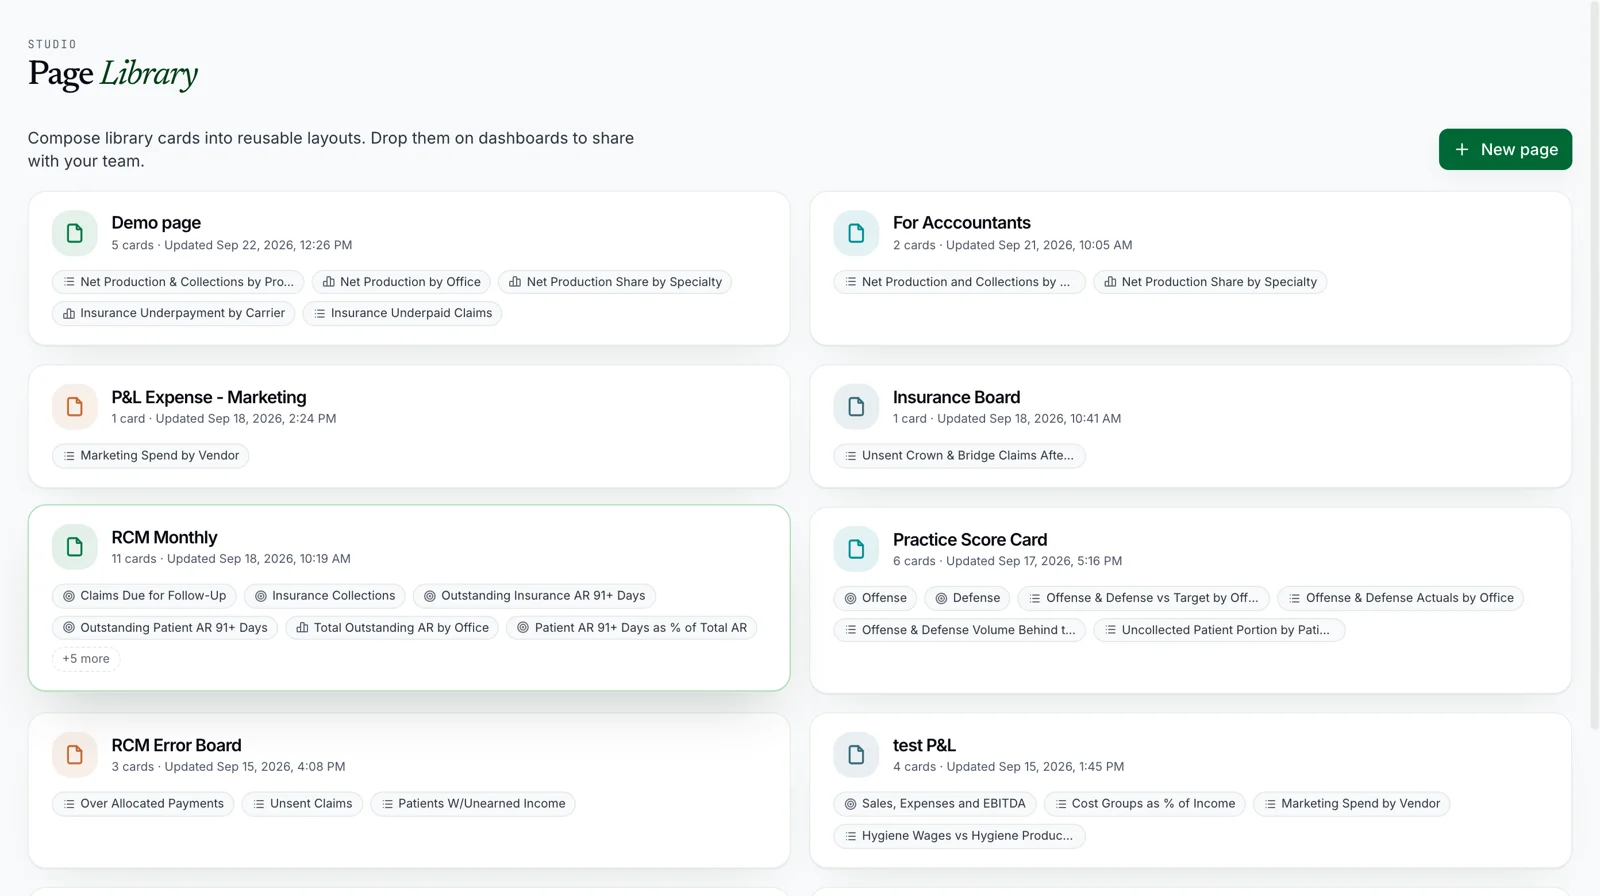
Build any page, then a dashboard
Put your cards together into pages, and your pages into dashboards for each role or office. Share them with your team.
Step 6
Build your podcast
Pick any card, page or dashboard, say what you want to hear and how often. The episode lands on your phone.
July's books are closed for Buckhead. Let's find out what kind of month that actually was. All right. July 1, 2026 through July 31, 2026. Give me the headline.
Strong month. Net production, that's the dollar value of dentistry actually completed after write-offs, came in at $184,883, up 29.4% from June.
29% in one month. That's real.
It is. And average daily net production was $10,109 against $7,543 in June, up 34.0%. So it wasn't one lucky big case. The whole month ran hotter.
Defense or offense first?
Defense, because that's where the best news is.
Okay. Cash in the bank. How do we do?
Collections. Money that actually landed in the account were $232,142, up 43.2% from June's $162,085.
That's more than we produced. Is that a problem?
No. It's a good sign. It means older balances that were sitting out there came in this month, on top of July's work. The accounts receivable pile got cleaned up.
And the patient side of that?
Patient collection percentage? The share of what patients personally owed that you actually collected was 100.1, up from 97.1. You collected essentially every dollar asked for at the front desk.
So the money discipline is working?
It's working. Keep the same at-the-desk routine, because this is the number that quietly protects everything else.
So how did we produce more? Did we work more days?
Fewer. 18 working days versus 19 in June, down 5.3%. You did more with less calendar.
Then where did it come from?
Two places. Average shifts per worked day went from 2.11 to 2.44, up 16.1%. More chairs running on the days you were open. And net production per shift was $4,135, up 15.4% from $3,583.
And per patient visit?
Average net production per appointment was $496 against $397, up 24.9%. Bigger, more valuable treatment per chair. That's the healthiest way to grow.
Anything in there I should watch?
Two things. Completed appointments per shift slipped to 8.34 from 9.03, down 7.6%. Fewer bodies per shift, higher value each. And the missed appointment rate, no shows and last minute cancellations, jumped to 14.1 from 9.4%.
That one I don't love.
Nor do I. At that level, you're giving away roughly one visit in seven. Tighten confirmation calls this month. That's the single cheapest production you can buy back.
Hygiene, are patients coming back on schedule?
Recare percentage, which is the share of due patients who actually got seen for their cleaning, was 87.5, down from 92.7. Still a good number. Just softer.
Worth keeping an eye on then.
Exactly that. If it keeps drifting, next quarter's hygiene schedule gets thin. And hygiene is your most reliable recurring revenue.
New patients?
73, up from 69, a 5.8% lift. And 155 exams versus 143, up 8.4%. The front of the funnel is healthy.
And deeper hygiene work?
Scaling and root planing, deep cleaning for gum disease, was 24.2% of new hygiene patients, down from 29.2. Fine range, just diagnosing it a little less often.
Case acceptance, how are we closing?
Treatment conversion, the share of diagnosed treatment patients said yes to, was 48.1, down from 55.7 in June.
So we saw more people and closed a smaller slice.
Right, exams were up 8.4% and conversion came down, so the opportunity was there. This is a coaching conversation, not a broken system. The dollars per appointment proved the closes you did make were substantial.
What would move it?
Same visit financial conversations. With 155 exams on the board, a few points of conversion is meaningful production without adding a single new patient. Two things for August. One offense, one defense. Offense, treatment conversion at 48.1. Get it back toward June's 55.7 with same visit case presentation. Defense, the missed appointment rate at 14.1. Confirmation calls and a short notice fill list.
And the story overall?
Fewer days, more chairs, richer treatment, and every dollar collected. That's a genuinely good month with two very fixable leaks. So protect the schedule and close more of what we're already diagnosing. Everything else here is working, and you should feel good about that.
The Daily Overview, every morning
Production, the schedule, and the treatment and hygiene opportunity already booked today. Refreshed every night.
Book a demo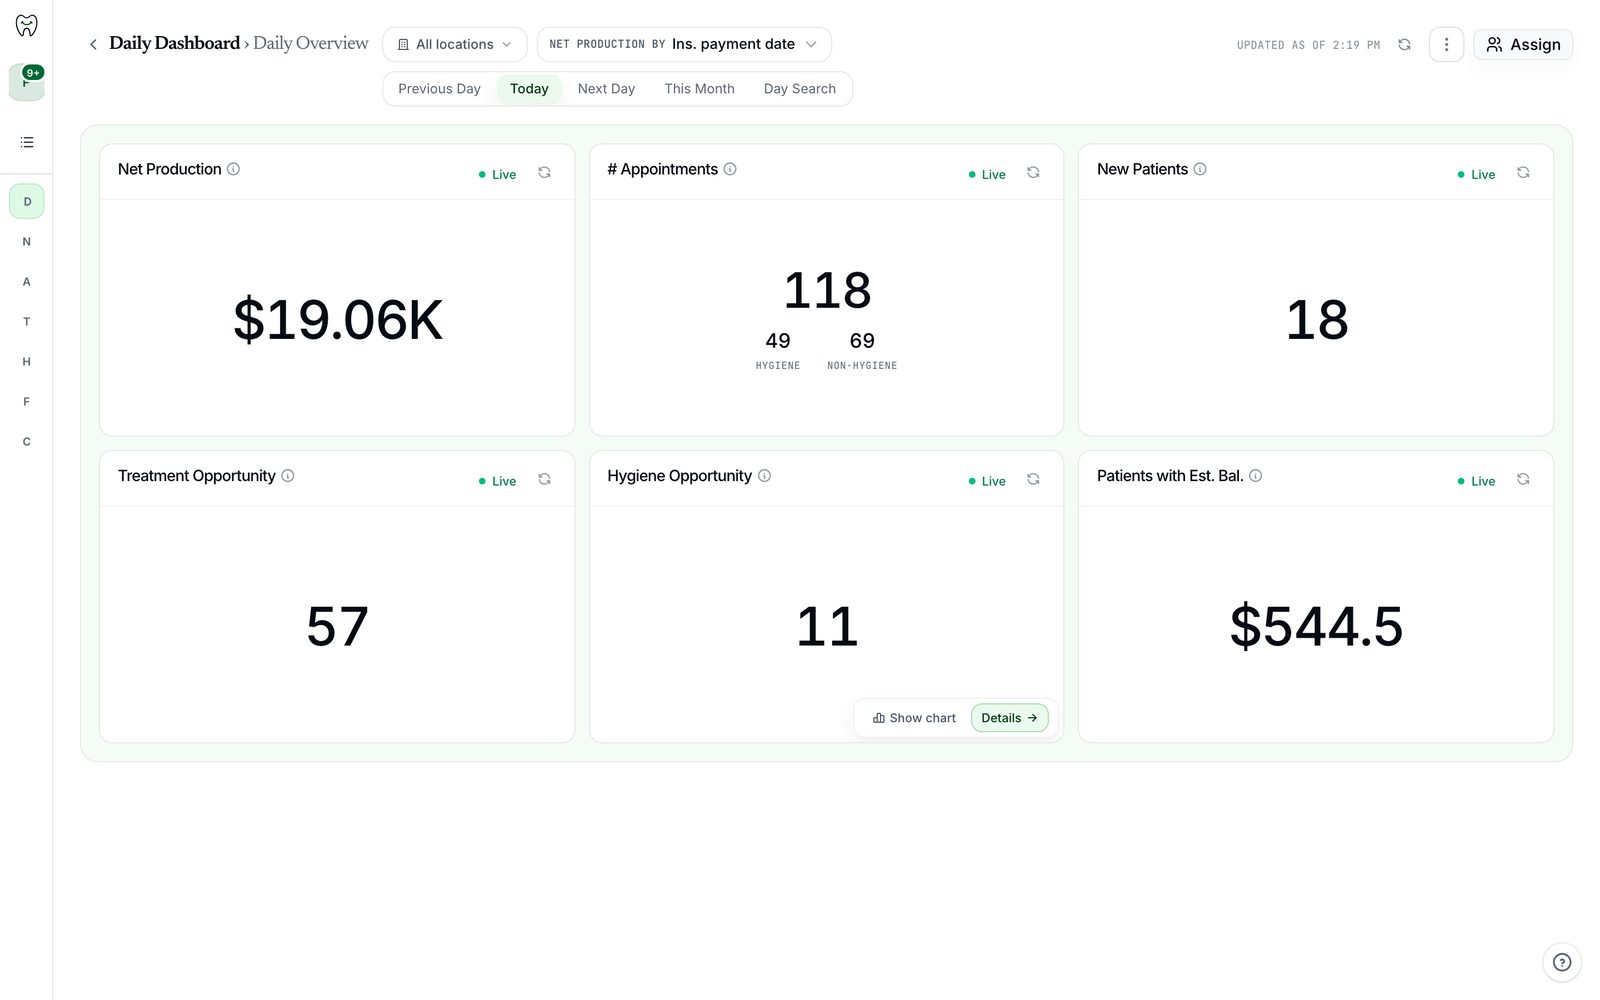
Questions
What do I get on day one?
Can I build my own dashboards?
How do the podcasts work?
How fresh is the data?
Can I get the data out?
Put your data to work.
Sign up todayNot ready to sign up? Book a demo with our team.
Connects to your practice software. $0 onboarding. No contracts. HIPAA compliant.